Here’s An Interesting Question. Do You Prefer to be Unobtrusive in Your Research?

Unobtrusive research differs from other more obtrusive survey type of research in that the researcher is not involved, present, noticeable or potentially impactful in collecting data.

Generally, measures used to collect data is important but sometimes may take a back seat to other considerations in research design like whether it is quantitative, qualitative, or mixed. Or perhaps to the type and style of statistical analysis.

Researchers take great care in formulating the best measures to properly and adequately collect data for analysis in order to answer an all-important research question. This typically involves utilizing information collected on or about individuals’ actions, behaviors, opinions, or beliefs to name a few. One of the main differences in collecting this information and data is whether researchers decide to employ obtrusive (i.e. noticeable or involved in a direct way) or unobtrusive (i.e. not noticeable or involved in any direct way) research methods.

Unobtrusive research involves methods of gathering data on subjects of research WITHOUT DIRECTLY interfering, interrupting or contacting the subjects and their natural and normal behaviors and actions. Traditionally, the specific methods of unobtrusive research include indirect measures, historical comparative analysis, content analysis and secondary data analysis. These methods mainly rely upon using a wide variety of sources including books, speeches, records, recordings, publicly available government documents or surveys, previously documented or analyzed information and the informal collection of data through simple observation.

This differs from survey research which involves the DIRECT CONTACT and questioning of research subjects to gain data and information on a specific research topic. Survey research typically takes on the form of a questionnaire or an interview. Survey questionnaires contain a series of pre-determined questions respondents answer via in-person, over the phone, or online either verbally, in writing or electronically. Interviews are concentrated on a more conversational tone where questions may be based on the responses of the subject and can be conducted in person or over the phone.

Unobtrusive research has some advantages over survey research. One major advantage is the elimination of biases introduced by researchers and/or subjects whereby subjects may alter their behavior or responses for researchers, or based on what they believe researchers want to hear or see. In addition, unobtrusive research contains easily repeated methods, it is easier to correct collection errors, it examines actual behavior over self-reported behavior, the data is easier to obtain, and it is generally less expensive.

The disadvantages of unobtrusive research, compared to survey research, may include issues with the validity of the research which can be compromised in that the original intent of the data collection, or the original data itself, may not exactly match the specific needs and requirements of the current research. In addition, researchers cannot control the specific types of information included in, or collected from, the original source or documentation which can lead to limited amounts of data for the current research topic. Furthermore, the methods employed to collect the original data, the original social and cultural context related to the primary source of information, the context of the original research and the potential biases and personal viewpoints of the original researchers collecting the data may impact the validity of data and reliability of the results of the current research study.

So, considering the types of data, the research topic and question you are investigating and the overall design of your research; the type and method of data measures should be an important consideration in your initial research design.

How to Quickly Transfer Data from Excel to SPSS for Analysis

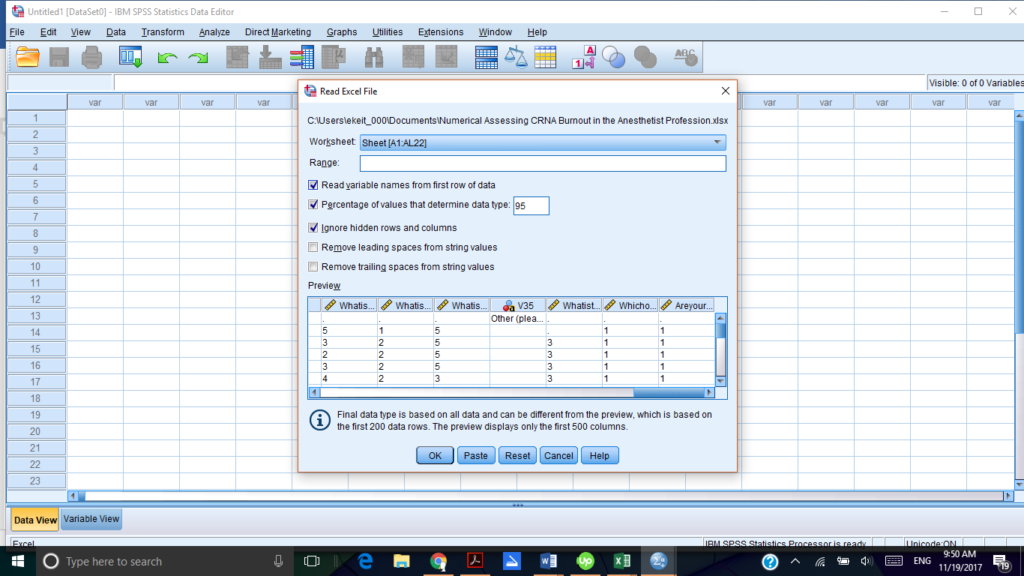
  1. To quickly merge your Excel raw data into an SPSS file, open your SPSS program and go to the FILE option and drop down to IMPORT DATA to select EXCEL data. (Note: you need to ensure your EXCEL data file consists of raw numbers with variable names in the first row to ensure easy transition of variables and data into SPSS.)

2. After selecting EXCEL, the file popup appears and you then go to your file containing the EXCEL data or type in the file name in the file name box and then select OPEN.


3. The READ EXCEL BOX then automatically appears and you want to keep all boxes checked, preview how the data looks and then if it appears accurate click OK.

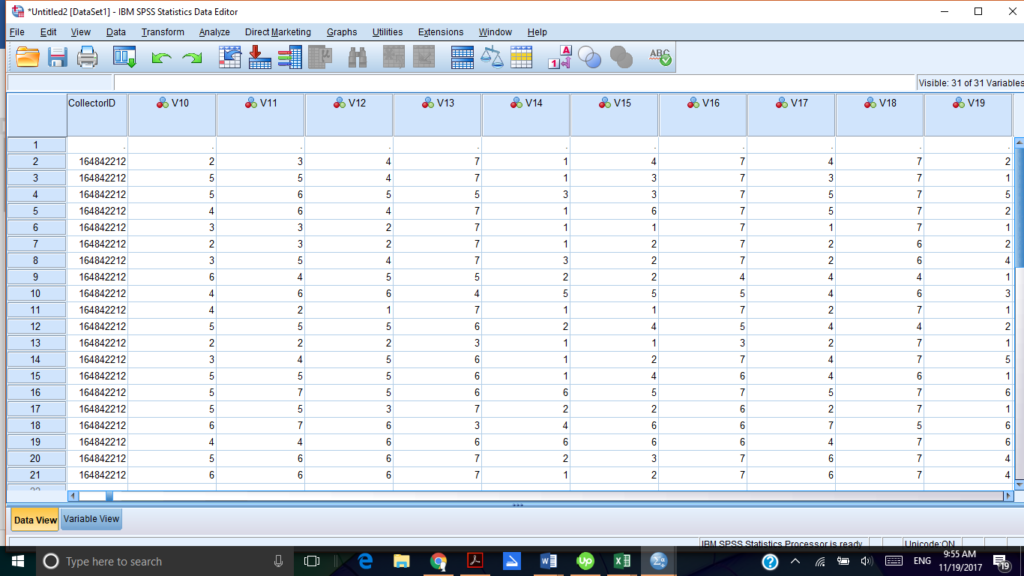
4. The SPSS file then appears with all of your raw data and variables included for your analysis.


Your Best Traits Can Serve The Public Well

Trait theory centers on an individual’s personality, psychological and biological traits, and their impact on criminal activity. This lesson will explore how the impact of trait theory on public policy can be seen in preventative, intervention, and rehabilitative programs.

What is Trait Theory?

Do you ever consider the type of person you are? Would you consider yourself outgoing, risk-taking, honest, intelligent, or disciplined? This is the basis of trait theory. ‘Trait theory’, as applied to criminal justice considers an individual’s personality, psychological and biological traits, and how they are associated with deviant, anti-social, or delinquent behavior. Modern trait theory considers how individuals’ traits interact with their environment, meaning how a person’s physical and social environment (family, peers, school, community) may trigger or influence an individual’s traits which lead to deviant or criminal behaviors. Trait theory has influenced the development of preventative, intervention, and rehabilitative policies and programs.

Aspects of Trait Theory

In order to understand trait theory and the implications for public policy, you need a little background on what it means and the individual parts that make up the theory. To do this, you’ll want to look at the three individual parts of trait theory.

Personality

This is simply those individual traits or attitudes that influence how a person will act in certain environments or circumstances.

Which of the five personality categories might you fall into?

  1. Extraversion – sociability, talkativeness, assertiveness
  2. Agreeableness– trust, kindness, affection
  3. Conscientiousness – good impulse control, organized, thoughtful
  4. Neuroticism – sadness, anxiety, moodiness
  5. Openness – adventurous, creative, imaginative.

Psychological

This focuses on factors like intelligence, learned behavior, and mental development or disorders which contribute to criminal or deviant behaviors.

Think about which of the three main categories you can relate to:

  • Psychodynamic – this is when childhood experiences and development leaves individuals frustrated or angry; this outlook limits a person’s ability to follow socially acceptable practices. Lack of affection from your parents leaves you angry and prompts you to break normal rules and vandalize property.
  • Behavioral – consider that an individuals’ learned experiences shape behavioral responses to events or circumstances. You may model your own behaviors after observed behaviors from family, friends, or media in aggressive and deviant ways like reacting violently to events and situations.
  • Cognitive – this focuses on how individuals perceive the world around them and how they process events from moral and informational perspectives. You may process the event of stealing as morally justified based on the information process that it is okay to disregard rules and doing what is ‘right’ to get what you want.

Biological

This centers around a person’s biological make-up and how it interacts with their social environment. Try to conceive how major biological traits influences your own behavior:

  • Genetic – inherited traits
  • Hormones – testosterone or progesterone
  • Brain/cognitive development – IQ, reasoning, logic
  • Physiological – functioning of parts of the brain and chemicals in the brain

Realize that you may contain some biological features which interact with your social environment to shape your behaviors, both positive and negative.

Implications of Trait Theory on Public Policy

Trait theory can aid the understanding and prevention of deviant behaviors. This has led to the development of preventative and rehabilitative policies within communities and the criminal justice system. These policies have influenced the development of programs, associations, clinics, and centers devoted to addressing the mental health, behavioral, decision making, and personality issues that lead to or sustain deviant criminal acts. These resources can be grouped into one of the three main areas; ‘primary, secondary, and tertiary prevention, intervention, and rehabilitation’.

  1. ‘Primary preventative measures’ – these are policies that focus on preventing an individual, primarily a child, from ever exhibiting deviant behaviors that may lead to crime or offending.
  2. ‘Secondary preventative/intervention measures’ – these are policies that focus on reducing the risk of an individual entering the criminal offending pattern or who are in situations or circumstances that tend to lead to such offending. These are individuals, mostly children, that are already displaying attitudes and behaviors that are deviant.
  3. ‘Tertiary preventative/rehabilitation measures’ – these are policies that focus on preventing re-offending and rehabilitating those individuals that are already in the criminal justice system.

Programs Developed from Trait Theory

‘Primary Personality Programs’

  • Child services programs to monitor a child’s development
  • Parenting programs to educate and improve child care
  • Parenting skills programs to improve bonds
  • Educational programs to help improve child development and skills.

‘Secondary Personality Programs’

  • Cognitive problem-solving skills training
  • Anger control training
  • Social interaction training to improve relationships and emotional responses
  • Multi-dimensional family-based, school-based, and community-based therapy to improve the dynamics of relationships and reactions.

‘Tertiary Personality Programs’

  • Family therapy
  • Foster care therapy
  • Cognitive based treatment programs designed to reduce recidivism and offending through decision-making and behavior adaptations.

‘Primary Psychological Programs’

  • Life skills training
  • Decision-making skills training
  • Parental skills training
  • Behavior management programs
  • School and community-based education and relationship activities

‘Secondary Psychological Programs’

  • Family and parent training
  • In-home visits
  • Multi-dimensional programs including community, school, government, and family resources.
  • Moral reasoning treatment/therapy
  • Problem-solving treatment/therapy
  • Thinking skills treatment/therapy.

‘Tertiary Psychological Programs’

  • Behavioral skills training and treatment
  • Family therapy
  • Martial therapy
  • Functional family therapy
  • Community and school-based therapy
  • Criminal justice monitoring and supervision in the community like halfway houses
  • Cognitive behavioral therapy

‘Primary Biological Programs’

  • Home based health and nutrition programs
  • Environmental enrichment programs focusing on health, activity, and education
  • Family and parenting skills training to promote healthy brain and mental health development.
  • School-based programs to boost intelligence, personality functioning, behavior, and decision-making skills.

‘Secondary Biological Programs’

  • Child-centered programs focusing on health-related factors
  • Parent or teacher related counseling to help improve behaviors.

‘Tertiary Biological Programs’

  • Cognitive behavioral therapy
  • Drug treatment programs
  • Physical health and well-being counseling and training programs.

Lesson Summary

Trait theory consists of the psychological, biological, and personality traits that interact with an individual’s social environment which can lead to criminal offending behaviors. Many of the initial preventative measures have influenced policies and programs involving children. Whether focused on skills, education, parental, or school-based programs, the intent is to never see an individual exhibit deviant behaviors. If an individual is at risk then the secondary level of prevention and intervention is in place to reduce the deviant behaviors already seen or improve the situation an individual finds themselves in which can lead to criminal offending.

These policies and programs center more on education, counseling, and treatment with families, school, and communities. Once individuals reach the criminal offending stage whether a juvenile, adolescent, or adult, then the policies shift towards more intervention and rehabilitation to desist the criminal offending. A major aspect of this is cognitive behavioral therapy, as well as the anger management, drug treatment, and skills training which are all currently utilized programs.

Surveys Serve as Crime Stoppers

Victim surveys and self-report surveys can help ascertain levels of crime rates and victimization, assist with identifying target populations, and help in the development of successful crime prevention policies and strategies.

What Are Crime Reports, Victim Surveys, and Self-Report Surveys?

Let your voice be heard. Stand up and be counted. Your vote counts.

These are all calls for civic participation when there are important community issues and where individuals have the right, and sometimes the obligation, to voice their opinions and concerns, and to shape the direction of these issues. But what about crime? What if you are a victim of crime? How are you able to be recognized or heard, beyond a local police department or court? And what can public policymakers do to address your concerns in order to prevent crime and victimization in the future? One way is through victim and self-report surveys.

Within the United States there are three main categories of crime surveys that inform, educate, and direct actions about crime. Here are the most widely used and recognized examples from those categories:

  1. Crime reports represented by the FBI’s Uniform Crime Report (UCR)
  2. Victim surveys identified with the National Crime Victimization Survey (NCVS)
  3. Self-report surveys (SRS) most associated with the National Youth Survey (NYS)

Crime Reports

The UCR is a long standing mechanism to formally collect information about crime incidents that are recorded and voluntarily provided by local and state law enforcement agencies. The UCR provides general tendencies in crime statistics categorized by the type of crime in localized jurisdictions in order to give overall pictures of crime trends across the United States. Crime reports such as the UCR lack specific information on offenders, methods, circumstances, and victims, as well as unreported or inaccurately described crimes. To combat this, more formalized victim and self-report surveys have been instituted in order to supplement crime reports and provide more detailed information on specific crime trends.

Victim and Self-Report Surveys

The NCVS is a victim survey wherein households across the United States are surveyed regarding crimes of which they’ve been a victim, or simply observed. In contrast to the UCR, the NCVS collects crime information for crimes not reported to police. The survey collects detailed ‘ ‘victim, offender, and situational context of crimes,’ ‘ such as the time, place, weapons used and actions taken during the crimes. This detailed information provides a more clear, realistic, and detailed view of representative crime rates and circumstances.

Self-report surveys (SRS) are unofficial criminological surveys of individuals who may or may not have engaged in crimes. Generally, these surveys are administered to juveniles who can be accessed through schools or correctional institutes. The NYS is the most well-known SRS; it specifically gauges a wide array of criminal acts and intentions, from drug use to assault. This has provided a more realistic understanding of how pervasive criminal activity is within the youth of the United States.

The Use of Victim and Self-Report Surveys

The NCVS and SRS question individuals directly and collect specific details on offenders, as well as victims and non-victims involved in the crimes. This allows for comparison and analysis of the characteristics that link offenders, victims and situational factors of crime and victimization. The most valuable statistics include:

Victim

  • Gender
  • Age
  • Race
  • Ethnicity
  • Socioeconomic status/income
  • Marital status
  • Education level
  • Home ownership/residence location

Offender

  • Age
  • Race
  • Ethnicity
  • Gender
  • Victim-offender relationship
  • Presence of drugs/alcohol

Crime

  • Location
  • Time of day/month of the year
  • Use of weapons
  • Injuries
  • Economic impacts
  • Victim defensive actions utilized and outcomes
  • Property type lost

Similar to victimization surveys, an SRS will also collect detailed information regarding comparable demographics of offenders. Specifically, there is increased focus on youths’ involvement in crime, allowing juvenile delinquency to be tracked and classified in more useful ways.

Implications of Crime Surveys

Having more accurate information about the volume, depth and nature of crime allows us to focus more on the sub-groups involved in crimes. Victim and self-report surveys highlight such sub-groups as:

Offenders

  • Juvenile delinquents
  • Gang members

Victims

  • Elderly
  • Ethnic minorities
  • Females
  • Suburbanites/urbanites

Understanding the specific characteristics of the sub-groups, individuals, and circumstances involved in all types of crimes allows criminologists and public policy makers to construct new ways to explain, understand, and prevent crimes. This knowledge can also help us develop theories to explain how and why crimes occur.

For example, surveys provide data on victim’s routine activities related to location, time and distance from offenders; this information led to the routine activities theory. This theory was tested and supported the premise that, with a lack of proper guardians (such as the police) at a certain time and location, opportunities for crime and victimization increase. Testing this theory also showed that offenders target individuals who are similar to themselves.

Specific factors that correlate to crime and victimization can also be analyzed to map out strategies to reduce crimes. Public policies such as tougher penalties for specific crimes, police focusing on ‘hot spots’ where most of crimes take place in a city, and using foot patrols or creating neighborhood watch programs all emanated from survey information. In addition, survey data has led to the growth of situational crime policies in which cities increase street lighting, patrols, guards, alarms, and CCTVs at locations identified in survey data pinpointing where and when crimes and victimization occur.

Lesson Summary

Crime reports began by categorizing crimes and crime incidents to give police and public policymakers general information on trends and crime to analyze the use of resources and manpower. Because the of lack of specific information about crimes, offenders, and victims in these reports, and the underreported statistics of crimes, surveys of the individuals involved in crimes have come to supplement these reports.

Victims surveys and self-report surveys unveil the true nature of crime by providing understanding of the actual depth of crime and victimization incidence. Specifically, surveys like the NCVS and NYS provide better information and understanding of how much more crime exists and the sub-groups of the population that are the offenders and victims of specific crimes. Furthermore, the specific characteristics of sub-groups and situations of crimes and victimization allow for factors to be identified that can limit and prevent crimes, leading to theories of victimization and situational crime prevention techniques.

How do Juveniles Become Delinquent?

Who are juvenile delinquents? What are their common characteristics or surrounding environments? What are the most common characteristics of juvenile victimization? This post covers the correlating factors and patterns of all these questions.

Origins of Juvenile Delinquency

Ever wonder what factors might lead to a child committing a crime? Would it surprise you that delinquency can begin before children are even born?

There is some evidence indicating that prenatal nutrition, mothers that smoke, or complications at birth are factors contributing to delinquency. Now of course, not all children in these circumstances become juvenile offenders, but it’s important to weigh these factors when they do.

Considering juvenile delinquency can begin early in a child’s life, let’s looks at the characteristics of children engaged in this type of delinquency.

Who Are They?

Picture Tom, a 17 year old, white teen, living in a high crime, poverty-ridden area of town. He’s just been arrested for theft. This is the picture of the most commonly arrested juvenile offender.

Recent arrest statistics for juvenile delinquency indicates offenders are typically between the ages of 13 and 17, with 17 being the most common. Most are males, though the number of female offenders is on the rise.

Most juvenile offenders arrested are white, however, black juveniles are arrested at higher rates than other races for violent crimes.

Now that you know the characteristics of juvenile offenders, you may ask yourself what causes them to offend.

The Correlates of Juvenile Delinquency

There are specific risk factors that correlate to the onset of juvenile delinquency. A consensus of research has consistently pointed towards the following:

Individual risk factors are those that are explicitly tied to an individual’s development and personality. More often than not, juvenile offenders exhibit aggression, hyperactivity, antisocial behavior, low IQ, low language IQ, attention problems, and impulsivity. These risk factors are most likely associated with substance abuse, risk-taking behaviors, and poor school performance.

Family risk factors are exclusive to parent-child dynamics and interactions within the home. These can include child maltreatment, poor parenting/supervision, home discord, parental conflict, antisocial parents, harsh discipline, aggressive parents, broken homes, and large family sizes.

Community-based risk factors are those occurring within the environment of the juvenile, like gangs, delinquent peers, severe school punishment, disorganized communities, and high crime areas.

However, there’s some hope. The majority of juvenile offenders that exhibit these traits or are exposed to many of these risk factors desist in late adolescence and early adulthood.

Chronic Juvenile Offenders

There is a small minority of offenders, however, that are considered chronic offenders. Chronic offendersare those that repeatedly commit serious or violent crimes such as theft, burglary, robbery, drug involvement, assault, rape, and murder.

Happily, as of 2015, juvenile arrests for violent crime are lower than they have been in 30 years. Perhaps it is partly because of our growing knowledge of the factors involved.

Children that display poor temperaments in early years are linked to chronic offending. Chronic juvenile offenders typically display three critical features early and often. In order of significance they are:

  1. Serious conduct disorders – in other words, antisocial behaviors.
  2. Poor personality/behavioral issues – poor learning skills, impulsivity, risk taking, aggression, a lack of empathy, poor attachments.
  3. Antisocial beliefs – negative attitudes towards police, teachers, or other authority figures; negative perceptions and distorted information processing.

There is also an established link between juvenile offending and child victimization. Child maltreatment is the most significant factor in this link.

This can include abuses of physical, sexual, or emotional natures, but also neglect. For example, if Mary allows her 7 year old son Jimmy to cross 5 miles of the city of Chicago by himself to get to school, this is an example of physical neglect. Mary has disregarded the physical safety of her child.

Or, as another example, perhaps Gary doesn’t pay attention to where his daughter Sarah is during the day, and consequently Sarah misses several days of school a week. This is an example of educational neglect.

Lesson Summary

Juvenile delinquency can depend on a number of factors, even those present before birth like in prenatal nutrition or complications. Other risk factors are categorized as

  • Individual risk factors – represented by aggression, impulsivity, and antisocial behaviors and attitudes
  • Family risk factors – takes the forms of maltreatment, poor, harsh, and anti-social parents.
  • Community based risk factors – represented by gang involvement, delinquent peers, and poverty.

Most juvenile delinquents desist upon reaching adulthood, but some become chronic offenders that repeatedly commit serious or violent crimes. These individuals tend to have poor temperaments including antisocial behaviors, behavioral issues, and negative attitudes towards authority figures.

There is also an established link between juvenile offending and child victimization. Child maltreatment is the most significant factor in this link.

The Intelligence of Modern Policing

Intelligence-led policing combines data and information with a top-down business like operational model used to address specific crime issues. Information is analyzed to identify trends, locations and offenders which allows top police executives to efficiently dispatch officers and resources to eliminate serious crimes perpetrated by serious, but small groups of offenders.

When you hear the term intelligence-led policing you might think of some type of covert, spy movie type of surveillance to gather information in a shadowy type of way.

In the world of policing, it means something totally different. Intelligence-led policing can be defined as a policing philosophy that follows a business or managerial model of operating an organization. Intelligence-led policing allows police departments to utilize data and information in order better evaluate crime trends and issues, thus allowing top decision makers to efficiently and effectively allocate resources and develop crime fighting strategies.

In other words, police departments can incorporate a decision-making system where information about crimes, crime trends, and specific groups of offenders is analyzed and then paired with executive strategies to properly direct ground level officers’ actions and resources in a specific, targeted effort for the sole purpose of reducing, eliminating and preventing specific crime issues and offenders.

Origins of Intelligence-led Policing

The origins of intelligence-led policing begin in the United Kingdom within the Kent Constabulary in the 1990’s as a response to budget cuts and growing trends in property crime. Essentially, the belief at the time was that there were a small number of offenders contributing to the vast majority of property crimes. Within this philosophy, less time was devoted to less crime-related calls to service, and more time was devoted to create information gathering units specifically analyzing the property crime issues. Essentially, the Kent Constabulary was most focused on targeting specific property crimes and the offenders responsible for them. As a result, they reduced the property crime rate by 24 percent.

Intelligence-led Policing in the United States

This model was adopted by police departments in the United States soon after the Kent model in the 1990’s. In its evolution within the police agencies, intelligence-led policing has taken root as a top downinformation based system. In a very simple model, crime analysts or analysis units take data from records, databases, and statements to identify trends and patterns.

In collaboration with various units within the police departments, this information is transformed into strategic actionable knowledge. In other words, this intelligence allows proper actions, strategies, and resources to be implemented in a specific way. This results in a targeted plan to combat specific crime issues and offenders that flows back down to the street level investigators and officers within the impacted crime areas.

For example, a police department analyzed crime trends in a popular area of the city. A plan was developed to specifically target socially impactful crimes such as burglaries. Information was gathered through archival data, crime patterns, victim reports, and street informants to produce a crime fighting model prioritizing a select group of offenders responsible for breaking and entering, robbery, and narcotics which ultimately reduced crime in that area.

Model of Intelligence-led Policing

This exemplifies the traditional intelligence-led policing 3-part model as follows:

(1) analysts interpret the crime trends and patterns;

(2) information, or intelligence, allows decision makers to form strategies to impact specific crimes and serious offenders;

(3) the plans and resources flow down to based level officers to disrupt the crimes and offenders.

The base model of intelligence-led policing

Intelligence-led policing has also evolved into the utilization of fusion centers which are large data analysis units solely devoted to constantly collecting information and data from various government, public, and private sources in order to fuse together intelligence for decision makers. This is most widely used in counter-terrorism efforts at the federal, state and local levels. However, it is also a mainstay within law enforcement agencies aimed at combating detrimental crimes perpetrated by serious groups of offenders.

The types of offenders that have been targeted include gangs, mafias, drug cartels, or groups of criminals operating in certain areas revealing a specific set of trends. A real world application can be viewed through an in-state regional fusion center established to coordinate all of the flow of information between various state law enforcement agencies to develop intelligence for executive police managers in order to direct the actions of a select group of ground level police personnel with specific pools of resources, making them available 24-7 to combat targeted crime issues.

Lesson Summary

Essentially, intelligence-led policing is a policing philosophy that takes on a business-like, decision-making, and managerial type of operational model. This top-down model enables information to be collected and analyzed so that specific, targeted crime issues, crime areas, and serious offenders are disrupted and eliminated. The collected data is transformed into intelligence which allows top police executives to make the appropriate decisions and strategies in order to expend the most energy in reducing and preventing the most detrimental crimes committed by a few but serious offenders.

Understanding Confidence Intervals

Confidence intervals can be an easy way to understand the amount of uncertainty in a sample estimate of a population, like the mean or proportion. This allows you to draw inferences on population values from each sample taken.

Making Estimations

How much your next pay raise will be? Perhaps $3,000 or $5,000? Hmm, it’s extremely difficult to estimate an exact number. You would have more success if you estimated your raise within a range of numbers.

Meaning, if you were to say that your next pay raise would be between $1,000 and $10,000, you would be more confident in your estimate. This is essentially how confidence intervals work.

What is a Confidence Interval?

Confidence Interval (CI) refers to the amount of uncertainty associated with a sample population estimate (the mean or proportion) of a true population.

Say you wanted to determine the average age of victims of robberies in Chicago last year. Now, while there is a true answer, say 30 years old, the best you can do is find an interval that that true answer probably lies in, say, 20-40 years old.

The confidence interval is the sample mean or proportion plus or minus the margin of error (ME), the value used to calculate the upper limit (40) and lower limit (20) of the sample statistic.

Before calculating the CI from a sample mean or proportion, choose either a 90%, 95%, or 99% confidence level (CL). This is the amount of uncertainty in the sampling method. Meaning each time the same sampling method is used, the true population value would be represented in 90%, 95%, or 99% of all the sample estimated CI’s. That also means that 10%, or 5%, or 1% would not contain the true population score.

Calculating CI – Mean

Let’s see how to calculate a confidence interval using the mean.

  1. Identify a population, select a representative sample, and note the number of the sample (n).
  2. Calculate the mean by adding all of the sample values and divide by n.
  3. Select the CL (typically 95%) and locate the corresponding t (z value), which is 1.96 for 95% CI. (NOTE: There are tables of pre-calculated z values for various confidence levels to utilize as a resource).
  4. Calculate the standard deviation (s) by subtracting each value in your sample from the mean, then square each result, then calculate the mean of all of those squared differences. This is known as the variance.
  5. Take the square root of the variance.
  6. Calculate the CI with the following formula:
null

Note that n uses the degrees of freedom, which is n – 1.

Finally, write out your CI mean ± the margin of error. The CI is between the upper limit (the sample mean plus the margin of error), and lower limit (the sample mean minus the margin of error).

Real World Mean Example

Let’s return to our earlier example. What is the average age of robbery victims in Chicago last year?

  1. Randomly sample 100 police reports of Chicago robberies last year. n = 100
  2. Record the ages of the victims, add them all up all, and divide by 100 to get the mean. Say the mean age in this case is 34.25 years.
  3. Utilizing a 95% CL, which has a standard z value of 1.96; calculate the standard deviation. With a mean of 34.25 and a standard deviation of 10, a margin of error of 8 is calculated with the CI formula.
  4. Your CI is 34.35 ± 8, or 26.35 to 42.35.

You can now say with 95% confidence, that if the true average age of all Chicago robbery victims last year was known, it would fall between 26.35 and 42.35 years of age.

Calculating CI – Proportion

When you’re faced with a population measured by categorical data (ex. gender) you can calculate the CI using a proportion with the following steps and formula:

null

1. Select an appropriate CL (95% is the most common, which is z*= 1.96).

2. Find the sample proportion by dividing the number of individuals that have the common shared characteristic of interest in the sample and divide that number by the total sample size.

3. Multiply the sample proportion by 1 minus the sample proportion, then divide by the sample size.

null

4. Take the square root of the result.

5. Multiply the answer by z*(1.96 for 95% CL)

6. Finally use the sample proportion plus or minus the result (margin of error) to give the confidence interval.

Real World Proportion Example

Let’s continue with the theme of robberies. This time, what if you wanted to determine the confidence interval for the percentage of female victims of robberies in Chicago. From the same sample (n=100), let’s say that 57 out of the 100 were female victims.

  • By dividing the number of females by 100 to get 0.57.
  • Using a CL of 95% which gives us a z* of 1.96, you first multiply 0.57 x (1-.57) divided by n = 100 which gives you 0.0025.
  1. Then take the square root of that number which gives you .05.
  2. Multiply .05 x 1.96, which equals .1.
  3. Write out your CI with the margin of error, which in this case would be .57 ±.1.

As a result, with 95% confidence, if the actual percentage of female robbery victims in Chicago was known, it would be between .47 and .67, or between 47% and 67%.

Lesson Summary

When studying a population, it is easier to generalize with a sample rather than studying the entire population. A Confidence Interval (CI) refers to the amount of uncertainty associated with a sample population estimate (the mean or proportion) of a true population. It’s represented by the CI ± the margin of error (upper and lower limits of the value).

To calculate the CI using a mean:

  1. Select the CL (typically 95%) and locate the corresponding t (z value), which is 1.96 for 95% CI.
  2. Calculate the standard deviation (s) by subtracting each value in your sample from the mean, square each result, then calculate the mean of all of those squared differences. This is known as the variance.
  3. Take the square root of the variance.
  4. Calculate the CI with the following formula:
null

To calculate the CI using a proportion, use:

null

1. Select an appropriate CL (95% is the most common, which is z*= 1.96).

2. Find the sample proportion by dividing the number of individuals of interest in the sample and divide that number by the total sample size.

3. Multiply the sample proportion by 1 minus the sample proportion, then divide by the sample size.

null

4. Take the square root of the result.

5. Multiply the answer by z*(1.96 for 95% CL)

6. Use the sample proportion plus or minus the result (margin of error) to give the confidence interval.